Posted August 15th, 2023
Jump to…
Dataset Background
This project started out as a Kaggle dataset which can be found here. As stated on Kaggle, the data was “scraped from airlinequality.com and contains text-based reviews in addition to reviewers’ ratings of available dimensions.” The dataset contains almost 130,000 records of customer reviews on a variety of airlines dating all the way back to 2001. Relevant features present in the original dataset include:
- Airline Name
- Cabin Type
- Travel Type
- Date Flown
- Origin Country
- Route
- Recommended (Y/N)
- Review
- Entertainment, Food, Ground Service, Seat Comfort, Service, Value, and Wi-Fi Ratings (0-5)
- Overall Score (1-10)
Python Overview (Jupyter Notebook)
The first thing I did was use the TextBlob library in Python to analyze the sentiments of the reviews for each record. In doing so, I could use that field to understand how different aspects of an airline’s overall product affected positivity or negativity of a customer review.
After importing TextBlob, other relevant libraries, and the dataset into my environment, I began cleaning and organizing the data. I dropped any rows with missing values and discovered that I still had almost 90,000 records to work with, dating back to April 2012. I also created new fields to represent the origin and destination cities of each review.
With the data cleaned and organized, I used TextBlob’s sentiment.polarity feature to assign a value from [-1.0, 1.0]. In this case, -1.0 indicates negativity, 1.0 indicates positivity, and 0 indicates neutrality. This data was then exported to an Excel file for later visualization in Tableau. The polarity values were extremely helpful in determining which aspect ratings were most impactful in a customer’s review, as shown in the table below.
| Aspect | Polarity Impact |
| Value | 0.0337 |
| Ground Service | 0.0268 |
| Service | 0.0235 |
| Seat Comfortability | 0.0228 |
| Food | 0.0168 |
| Entertainment | 0.0027 |
| Wi-Fi | -0.0045 |
While I had a pretty solid understanding of what affected the polarity of customer reviews, I wanted something similar for the Overall Score feature in the dataset. I decided to construct a linear regression model that could explain the variance in the Overall Score. Firstly, I ensured to one-hot encode several of the categorical variables present in the data, such as Month Flown, Cabin Type, and Travel Type. Additionally, I wanted to ensure that multicollinearity would not inflate my results. Evaluating the correlation matrix of all possible features allowed me to drop several highly correlated variables. In the end, the model had an R2 of 0.831, indicating good fit. Further, an MAE of 0.911 indicates that the predictions of the model, on average, are about 1 Overall Score away from being accurate.
Dashboard Preview (interactive view)
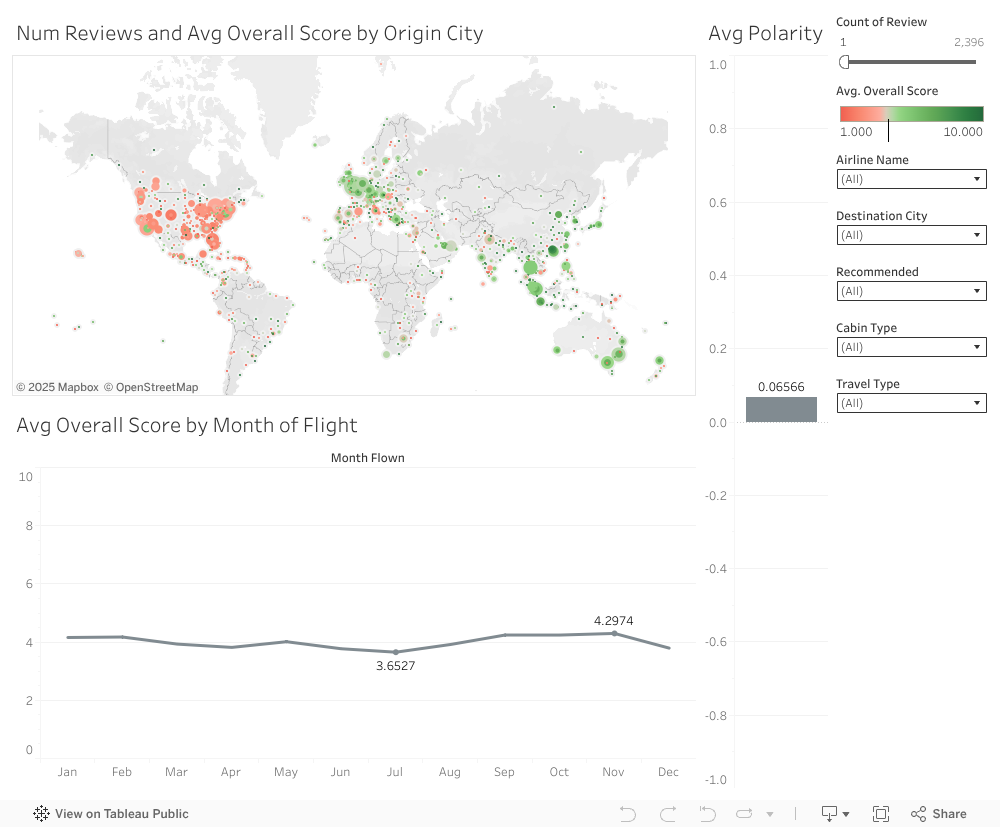
Analysis
Less Is More
The coefficients from the regression model and exploration of the Travel Type filter on the dashboard confirm this. When it comes to who you are traveling with, less fellow travelers results in higher Polarity and Overall Score in customer reviews. In fact, solo travel for both leisure and business recorded the highest average polarity and seem to have the highest positive affect on overall score. Airlines should tailor their policies to benefit larger parties. For instance, a per-ticket price discount could be very impactful for boosting reviews of family travel. Especially given that Value Rating impacts Polarity and Overall Score so heavily. Further research should be conducted to identify the pain points of larger groups of travelers.
Tech Is Not Impactful
Entertainment and Wi-Fi have negligible impact on the outcomes of reviews for airline customers. This is evident given the low polarity impact scores and model coefficients for both ratings. With the increased prevalence of streaming services like Netflix and Spotify, airline customers are becoming more self-reliant for entertainment. These services offer the capability to download media such as movies, TV shows, music, and podcasts, rendering airlines’ Wi-Fi and entertainment useless. Airlines should redirect their spending towards high impact areas such as service(ground and air), seat comfort, and food.
The 9/11 Effect
While inspecting the world map section of the dashboard, one thing jumps off the screen. There is a high concentration of red (indicating below-average Overall Scores) in the United States. Following the tragic events of September 11th, 2001, it is no secret that US airport security became one of, if not the most stringent in the world. This extremely strict security results in higher concentration of travelers, longer wait times, and a host of other residual impacts that lower the quality of the flying experience. While I certainly am not recommending the abolishment of the TSA, airlines and airports alike would do well to consider policies that ease the stress of travelers in the US, while keeping them safe. Some suggestions that I resonate with can be found here.
